Integrovaná WLAN analýza
Advanced network discovery – finds devices, networks and problems in seconds
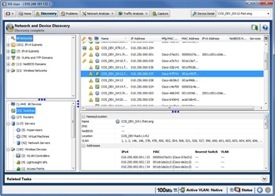 As soon as OptiView XG is connected to the network, it automatically begins to discover devices on the network, with no interaction required, by monitoring traffic and actively querying hosts. IT staff can immediately see what is on the network and where it is connected, by switch, slot and port number. They can investigate and quickly locate “suspect” devices and with minimum effort and identify problems associated with device misconfigurations.
The OptiView XG categorizes devices by type: interconnect (routers, switches), servers, hypervisors, virtual machines, printers, SNMP agents, VoIP devices, wireless devices, and other hosts. Additionally, networks are classified by IPv4 and IPv6 Subnets, VLANs, NetBIOS Domains and IPX Networks, and Wireless Networks together with host membership within each classification. Network devices that may be experiencing problems are also discovered.
 Most network analyzers and troubleshooting tools have limited visibility in today’s networks: usually a single broadcast domain or VLAN, but the OptiView XG Network Analysis Tablet can also be configured to perform a discovery of up to 30,000 devices on an off-broadcast domain subnet to extend its discovery beyond the broadcast domain or local VLAN boundaries, across your enterprise network, into remote sites and users. Generate up-to-date HTML and PDF format inventory reports of devices both on the attached network and also on networks at remote sites.
Discover and test through wireless connections
OptiView XG has the unique capability for fast discovery through a wireless connection. This keeps you aware of the network around you even when you moving through your site. You can unplug from the network and still be confident that the tablet is analyzing your critical devices through a wireless connection, even when moving to a different location – without losing any data. This offers a perfect solution for testing roaming handoffs.
VoIP and wireless device discovery
The OptiView XG will discover VoIP devices including call managers and IP phones from Cisco®, Nortel®, Avaya® and Mitel®. Device capabilities and configurations may be viewed, allowing the user to easily identify and correct configuration issues during VoIP deployment.
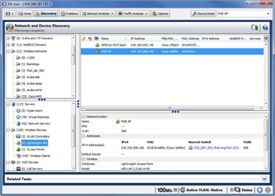
The OptiView XG also discovers and categorizes wireless LAN controllers, lightweight access points, intelligent access points and wireless clients. Detailed device information is provided from Cisco Wireless LAN controllers and LWAPs, including the wireless networks associated with the controller, the SSIDs, security and QoS parameters, the lightweight APs being controlled and the 802.11 protocol in use.
IPv6 Discovery
 The OptiView XG will discover and display complete IPv6 network and device inventory including routers, switches, wireless AP's, DHCP6 servers and hosts. It enables you to identify active IPv6 devices in the network and those that may have problems in single-stack IPv6 networks. Router advertisements are analyzed and the OptiView XG displays detailed router information and settings. Easily identify applications that may be communicating using both IPv4 and IPv6 protocols.
Detect devices using tunneling mechanisms and identify the tunnels in use. Undetected or unauthorized tunneling could represent a serious security risk.
Real-time in- depth infrastructure device analysis speeds troubleshooting
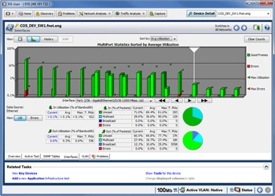
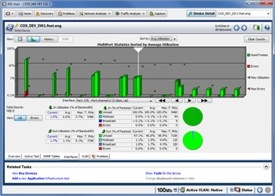 Get granular, real-time (updated every 30 seconds) interface utilization and errors for determining if excessive traffic is the cause of performance problems. This granular data can be collected for 24 hours. Interfaces can be quickly sorted by I/F index, utilization, broadcasts, errors, or collisions.
In-depth analysis, including:
- A tabular view of all switch port configurations, including the identity of each host and where it is connected.
- A graphical view of utilization and error rates on each switch port to see over-subscribed or error ports at a glance.
Quickly determine if performance problems are related to link speed or duplex misconfigurations, over-utilization or excessive hosts on a port.
VLAN discovery and analysis
 Determine if connectivity problems are related to VLAN configuration by seeing information such as:
- VLANs that are configured on the switch
- Interfaces that are members of each VLAN
- Identification of trunk or uplink ports, together with the trunking protocol in use
- Identification of which hosts are members of each VLAN.
Router and WAN link analysis
 In-depth device analysis identifies router ARP cache or routing table errors and also provides visibility to manage and troubleshoot costly
WAN links. See WAN link configuration, a graphical display of utilization and error rates and identification of specific error types on ISDN, Frame Relay, T1/E1, T3 and ATM links.
Built-in telnet and web browser allow reconfiguration of devices directly from the OptiView XG.
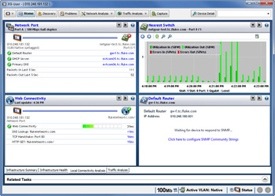
Network connectivity and link validation
Get an ultra-fast read on where you are connected, the type and speed of link, nearest switch, local traffic, DHCP/DNS services, and whether you have a viable internet connection. This dashboard is ideal for quickly validating moves, adds and changes.
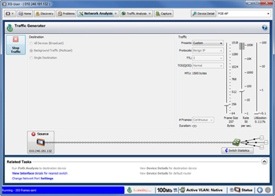
Traffic generation
 Assess network readiness for new deployments by determining the impact of a new application, or the addition of network users, by stressing your network with simulated traffic – up to full 10 Gbps.
Protocol type, frame size, frame rate, percentage utilization and number of frames to transmit are user configurable, along with the type of traffic: Broadcast, Multicast or Unicast.
 Selectable protocols include: Benign Ethernet, Benign LLC 802.2, NetBEUI,
Benign IP, IP ICMP Echo, IP UDP Echo, IP UDP Discard, IP UDP NFS and IP UDP NetBIOS. Selecting an IP protocol allows you to select Time to Live (TTL) parameters and TOS (QOS) parameters such as Minimum Delay, Maximum Throughput, Maximum Reliability, Minimum Monetary Cost and Maximum Security to ensure correct routing configurations.
Throughput Testing
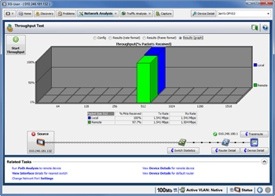 The throughput test measures bidirectional data flow between two Fluke Networks’ devices to validate LAN and WAN throughput capabilities. The throughput test requires a second device to communicate with on your network. That second device can either be an OptiView XG Network Analysis Tablet (for 10 Gbps throughput) or OptiView Management Appliance, or an EtherScope™ or OneTouch™ Network Assistant, or LinkRunner™ Pro Reflector (up to 1 Gbps).
The Throughput test allows you to configure the following parameters:
- Data speed (up to10 Gbps) – maximum rate is determined by the link speed and duplex.
- Frame size – choose from seven different frame sizes or select sweep to run the test on seven preset frame sizes. OptiView XG provides support for jumbo frames up to 9000 bytes.
- Content – select payload for all 1s, all 0s, alternating 1s and 0s or random.
- Test duration can be 2 seconds to 18 hours.
Test results can be viewed in a tabular or graphical format. The Rate Format tabular view indicates the local and remote transmit and receive rates together with the total percentage of frames received by both devices. Switching to tabular Frame Format view shows the number of local and remote frames transmitted and received, together with the total percentage of frames received by both devices